Devices: Overview
Devices are the first stage in the DataStream processing flow. They receive telemetry from external sources and convert that data to a standardized format for pipeline processing.
Provider → Device → Preprocessing → Pipeline → Postprocessing → Target → Consumer
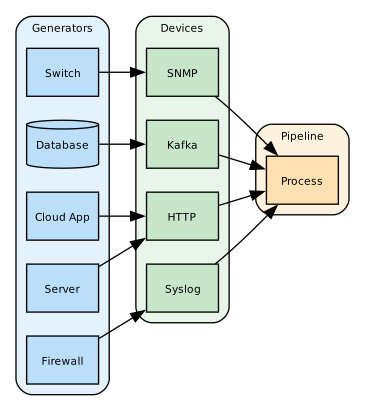
As such, they are defined using a standardized YAML configuration format that specifies its behavior, connection parameters, and processing options. DataStream uses devices as an abstraction layer that decouples data sources from pipelines.
Each device type provides specific configuration options detailed in their respective sections. For GUI-based device management, see Devices Management. To apply reusable collection rules across multiple devices, see Datasets and Profiles.
Definitions
Devices operate on the following principles:
- Unified Configuration Structure: All devices share a common configuration framework with device-specific properties.
- Data Collection: Devices receive data through network connections, APIs, or direct system access.
- Pipeline Integration: Devices can link to preprocessing pipelines for data transformation.
- Stateful Operation: Devices maintain their operational state and can be enabled or disabled.
Devices enable:
Authentication: Basic authentication, API keys, HMAC signing, and client certificates.
Encryption: TLS/SSL, SNMPv3 privacy, and custom encryption.
Firewalling: Source-IPaccess_listrules on the network and OTLP listeners, applied before parsing and authentication.
They also provide access control, and audit logging.
Configuration
All devices share the following base configuration fields:
| Field | Required | Default | Description |
|---|---|---|---|
id | Y | - | Unique numeric identifier |
name | Y | - | Device name |
description | N | - | Optional description of the device's purpose |
type | Y | - | Device type identifier (e.g., http, syslog, tcp) |
tags | N | - | Array of labels for categorization |
pipelines | N | - | Array of preprocessing pipeline references (processed sequentially). On Agents, enables local processing before data reaches Director. |
status | N | true | Boolean flag to enable/disable the device |
Each device type provides specific options detailed in its respective section.
Use the id of the device to refer to it in your configurations.
Example:
devices:
  - id: 1
    name: http_logs
    type: http
    properties:
      port: 8080
      content_type: "application/json"
This is an HTTP device listening on port 8080, and it expects the incoming data to be in JSON format.
Changes That Restart a Device
The Director restarts any device, whatever its type, when its name, retention, max_buffer_size or split_mode changes. The collector takes these once, at its start, and every record it writes carries the name and the retention.
Before, a rename or a retention change kept the old values on every record, and a new max_buffer_size did nothing, until something unrelated restarted the device. The Director-wide max_buffer_size is still taken by each device at its next start.
Device-to-Pipeline Handoff
When a device receives data, it performs initial format conversion before passing to pipelines:
- Raw Input: Device receives data in its native protocol format (syslog message, HTTP POST body, Kafka record, etc.)
- Parsing: Device parses protocol-specific headers and metadata
- Normalization: Device creates a standardized event structure with common fields (
message,host,timestamp) - Pipeline Input: Normalized event is passed to any attached preprocessing pipelines (via the
pipelinesfield)
Preprocessing pipelines attached to devices execute sequentially in the order specified. This enables filtering, enrichment, and transformation before data enters the routing stage.
Device Types
Devices are either push-type, where the source connects to DataStream and DataStream listens, or pull-type, where DataStream connects outbound to the source and polls it. Pull-type devices are marked Pull-type in the catalog.
The supported types are grouped by platform and protocol family - cloud services, message queues, databases, analytics platforms, operating systems, network protocols, and honeypots. See Devices: Catalog for the complete list.
Honeypots differ from every other device type: they are decoy services that emulate a real protocol and log each interaction, so they receive no production telemetry. The connection attempt is itself the observation, and captured credentials are recorded in cleartext or as crackable hashes. Several can be deployed together under one shared identity to emulate a complete Active Directory Domain Controller - see Domain Controller.
Use Cases
Devices can be used in the following scenarios:
-
Infrastructure monitoring: Provides system performance metrics, event logs, resource utilization, and service availability information.
-
Security operations: Enables security event monitoring, threat detection, compliance monitoring, and provides audit trails.
-
Application telemetry: Provides application logs and performance metrics, and enables error tracking and user activity monitoring.
-
Network monitoring: Provides network device logs and SNMP data, and enables traffic analysis and connection tracking.
Implementation Strategies
The following strategies optimize device deployment and data collection.
Monitoring
For monitoring operating systems, Director uses a unified agent-based approach with two types of deployment. For full deployment details, see Agents.
Managed (Traditional): The agent is installed and managed by system administrators. This provides persistent installation on the target system. Local data is buffered in the emergence of network issues. The agent runs on Windows, Linux, Oracle Solaris (x86), AIX and macOS, and enrollment templates take all five.
Auto-managed (Agentless): The agent is automatically deployed and managed, no manual installation is required. Auto-managed agents provide local data buffering, network resilience, and performance optimization. This deployment type is self-healing, since the agent is automatically redeployed if the process terminates. Also, it supports remote credential management. Deployment is done using WinRM for Windows, and SSH for Linux.
Both approaches provide local data processing, store-and-forward capability against connectivity issues, real-time metrics and events, and native OS monitoring. The key difference is deployment and lifecycle management, not functionality.
Read over SSH (no agent): Oracle Solaris, AIX, and macOS devices can also be read without an agent. An Agentless device of these three is not an agent deployment: Director logs in to the host over SSH and runs read-only commands for its own collection, and any scripts assigned to the device with the login's rights; nothing is installed on the host and no agent is deployed to it. What each device reads is decided by its datasets — see Solaris, AIX, and macOS Datasets.
Read through the vSphere API (no agent): a VMware vSphere device polls one vCenter Server or one standalone ESXi host from Director, and reads every ESXi host and virtual machine behind it; nothing is installed on vCenter or the hosts, and nothing it finds is registered as a device. What it reads is decided by its datasets — see VMware vSphere Datasets.
Read through the Cloud Director API (no agent): a VMware Cloud Director device polls one Cloud Director from Director, and reads its organizations and their users, its VDCs, vApps, and virtual machines, its audit trail, and, for a System administrator, the vCenter Servers attached to it and their ESXi hosts; nothing is installed on the cloud's cells, and nothing it finds is registered as a device. What it reads is decided by its datasets — see VMware Cloud Director Datasets.
Read through the platform's API (no agent): a Sangfor HCI device polls one Sangfor HCI management platform from Director, and reads every host and virtual machine it manages; nothing is installed on the platform or its hosts, and nothing it finds is registered as a device. What it reads is decided by its datasets — see Sangfor HCI Datasets.
Read through the cluster's API server (no agent): a Red Hat OpenShift device polls one OpenShift cluster from Director, and reads its nodes, projects, and pods, its replication controllers, services, and service accounts, its persistent volume claims and CSI drivers, its network configuration, its users, and its events; nothing is installed in the cluster, and nothing it finds is registered as a device. What it reads is decided by its datasets — see Red Hat OpenShift Datasets. The nodes' and pods' usage, and the pods' logs, come from the Linux agent's Kubernetes Metrics and Kubernetes Pod Logs datasets.
Read through the engine's REST API (no agent): an oVirt / Red Hat Virtualization device polls one oVirt engine or Red Hat Virtualization Manager from Director, and reads its hosts and their processors and network interfaces, its users and storage domains, its virtual machines and their network interfaces, snapshots, and disks, how the hosts and machines are doing, and its events; nothing is installed on the engine or its hosts, and nothing it finds is registered as a device. What it reads is decided by its datasets — see oVirt / Red Hat Virtualization Datasets.
Read through the cluster's API (no agent): a Proxmox VE device polls one Proxmox VE cluster, or a node that stands alone, from Director through the API of one of its nodes, and reads every node, virtual machine, container, and storage of the cluster, how each is doing, the tasks its nodes ran, and its cluster log; nothing is installed on the nodes, and nothing it finds is registered as a device. What it reads is decided by its datasets — see Proxmox VE Datasets.
Read through the host's libvirt daemon (no agent): a libvirt (KVM/QEMU) device polls one KVM/QEMU host from Director through its libvirt daemon, over SSH, TLS, or TCP, or on Director's own host, and reads the host itself, its domains as they are configured, and how the host, the domains, and their vCPUs, network interfaces, and disks are doing; nothing is installed on the host, and nothing it finds is registered as a device. What it reads is decided by its datasets — see libvirt Datasets.
Swept from the Director (no agent): an IPAM device sweeps one IPv4 subnet, a /20 at most, from Director with ICMP echoes and TCP connects, and writes which of its addresses are in use, their open ports and names, and how full the subnet is; nothing is installed on the subnet, and nothing it finds is registered as a device. What it writes is decided by its datasets — see IPAM Datasets.
Checked from the Director (no agent): a Website, HTTP Check, TCP Check, DNS Check, ICMP Check, or TLS Check device checks one service from Director, as a client would — a page loaded in Director's headless browser, a URL, a TCP port, a name at a resolver, a host by ICMP echo, or a service's TLS handshake — and writes the result of every check itself, up or down, with the state the service is in; nothing is installed on the service. What a website writes beside its results is decided by its datasets, and a check has none — see Service Check Datasets.
Read over S7comm (no agent): a Siemens S7 device reads one Siemens S7 PLC from Director over ISO-on-TCP, by its CPU's rack and slot or by TSAP: the data blocks, inputs, outputs, markers, timers, and counters its datasets name; nothing is installed on the PLC, and the device never writes to it. What it reads is decided by its datasets, each a table of typed fields, which the device's page documents.
Read and subscribed to over OPC UA (no agent): an OPC UA device reads the nodes of one OPC UA server — a PLC, a protocol gateway, a SCADA or historian, or an edge server — from Director, over one session it secures as the server's endpoints allow; nothing is installed on the server. What it collects is decided by its datasets, each a table of named nodes read on an interval or subscribed to, which the device's page documents.
Subscribed to over gNMI (no agent): a gNMI device subscribes to one network device's gNMI server from Director — Cisco IOS XR, IOS XE and NX-OS, Juniper, Arista, Nokia, and the others that speak gNMI — and holds one Subscribe stream open, which the server streams its telemetry over, sampled or as it changes; nothing is installed on the network device. What it subscribes to is decided by its datasets, each a path of the server's data tree, which the device's page documents.
Dialed out to over gRPC or TCP (no agent): a Cisco MDT device listens on Director for the model-driven telemetry Cisco IOS XR, IOS XE and NX-OS routers dial out, and writes every row of a telemetry message as a record; the router pushes, so Director needs no credentials of it and polls nothing. It is the dial-out counterpart of the gNMI device.
Subscribed to over JTI (no agent): a Juniper JTI device subscribes to the sensors of one Junos device from Director over Juniper's JTI gRPC service, signing in through its Login service, and holds a subscription for every dataset on one connection; nothing is installed on the Junos device. Each dataset is a group of sensor paths, sampled on an interval, which the device's page documents.
Layered Collectors
Configure multiple devices to handle different aspects of data collection:
- External-facing HTTP endpoints for application logs
- Internal TCP/UDP listeners for network device logs
- Specialized connectors for cloud and security products